An Analysis of Scorelines at Tennis Majors from 2000-2016
Introduction
For more than 100 years, men have played best-of-five sets at the four professional tennis majors. There has been, however, much debate on social media and elsewhere about the merits of moving to a best-of-three format. Ben Rothenberg of The New York Times, a vocal proponent of shortening matches, wrote an article five years ago stating this case. But, for an issue that generates passionate opinions, it is rare to see actual statistics cited.
To satisfy my own curiosity, I analyzed the scoreline of every match at a major from 2000 through 2016, which encompasses 8,253 matches after walkovers and retirements are considered. The data is cross-referenced by year, venue, in which round the match occurred as well as its duration. What follows are the more interesting results that I found.
Global Results
The following charts are based on all completed matches at majors from 2000-2016 less retirements and walkovers. This totals 8,253 matches. Week One refers to the first three rounds of a major; Week Two is from the Round of 16 onward.
How many sets does the average match last?
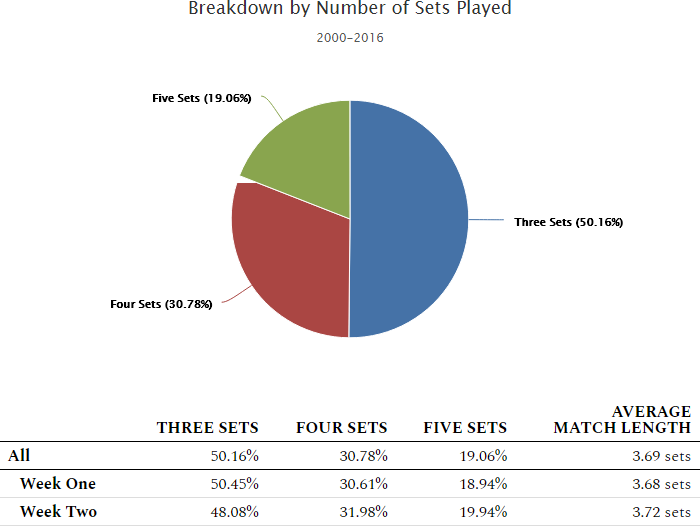
| Three Sets | Four Sets | Five Sets | Average Match Length |
|
|---|---|---|---|---|
| All | 50.16% | 30.78% | 19.06% | 3.69 sets |
| Week One | 50.45% | 30.61% | 18.94% | 3.68 sets |
| Week Two | 48.08% | 31.98% | 19.94% | 3.72 sets |
Note:
Overall, almost exactly half of all matches ended in a straight-sets victory.
The proportion of three-set matches drops in Week 2 when there are more four-set and five-set matches played.
What is the breakdown of these matches?
| Set 1 Set 2 Set 3 Set 4 Set 5 |
W W W |
W W L W |
W L W W |
L W W W |
W W L L W |
W L W L W |
L W W L W |
W L L W W |
L W L W W |
L L W W W |
|---|---|---|---|---|---|---|---|---|---|---|
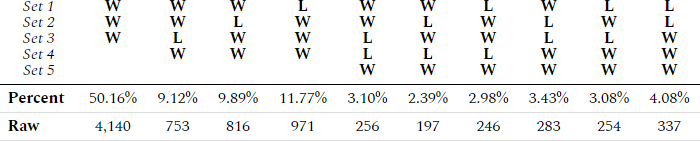
| Percent | 50.16% | 9.12% | 9.89% | 11.77% | 3.10% | 2.39% | 2.98% | 3.43% | 3.08% | 4.08% |
| Raw | 4,140 | 753 | 816 | 971 | 256 | 197 | 246 | 283 | 254 | 337 |
Note:
The winner of the first set goes on to win 78.09% of the matches.
The winner of the first two sets goes on to win 93.86% of the matches.
If the first two sets are split, the winner of the third set goes on to win 80.59% of the matches.
All other things equal, the winner of his best-of-five match would've lost 10.59% of the time if it had been played as a best-of-three match.
The most common four-set scoreline is when the winner loses the first set only to win the next three.
The most common five-set scoreline is when the winner loses the first two sets only to win the next three.
How long does the average match last?
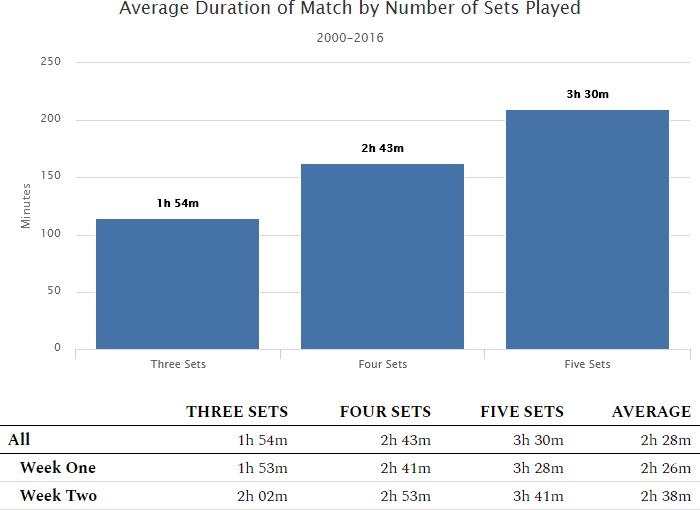
| Three Sets | Four Sets | Five Sets | Average | |
|---|---|---|---|---|
| All | 1h 54m | 2h 43m | 3h 30m | 2h 28m |
| Week One | 1h 53m | 2h 41m | 3h 28m | 2h 26m |
| Week Two | 2h 02m | 2h 53m | 3h 41m | 2h 38m |
Note:
The average duration of a set is 39 minutes 58 seconds.
The average duration of a match increases by 12 minutes in Week Two as compared to Week One.
Results by Major
The following charts are for the seventeen years of results further broken down by the four majors. The majors are listed in the order of their appearance in the calendar year.
How Many Sets Does the Average Match Last?
| Three Sets | Four Sets | Five Sets | Average Match Length |
|
|---|---|---|---|---|
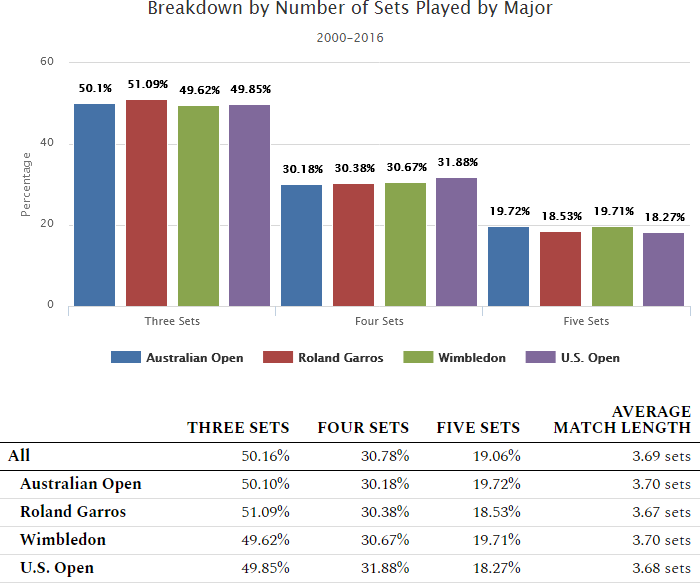
| All | 50.16% | 30.78% | 19.06% | 3.69 sets |
| Australian Open | 50.10% | 30.18% | 19.72% | 3.70 sets |
| Roland Garros | 51.09% | 30.38% | 18.53% | 3.67 sets |
| Wimbledon | 49.62% | 30.67% | 19.71% | 3.70 sets |
| U.S. Open | 49.85% | 31.88% | 18.27% | 3.68 sets |
Note:
Wimbledon has the lowest percentage of three-set matches; Roland Garros has the highest.
The U.S. Open has the highest percentage of four-set matches and the lowest percentage of five-set matches.
If the conventional wisdom of the relative speed of court surfaces is to be believed, then the percentage of matches that go three sets correlates to the speed of the court surface.
How long does the average match last?
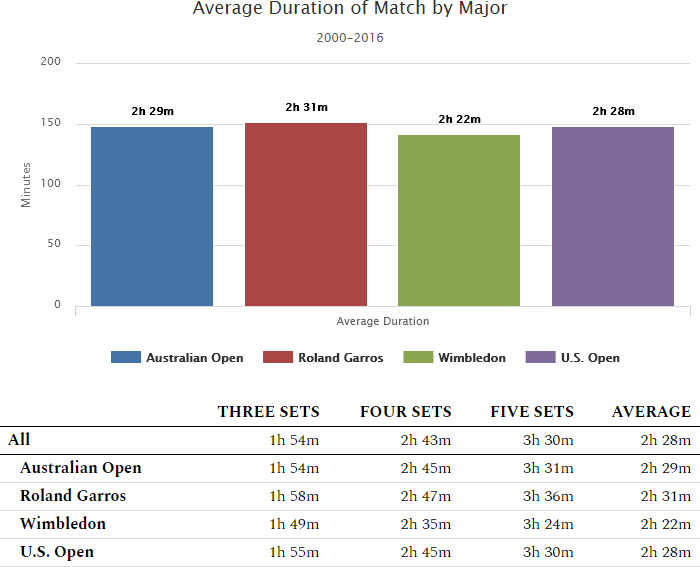
| Three Sets | Four Sets | Five Sets | Average | |
|---|---|---|---|---|
| All | 1h 54m | 2h 43m | 3h 30m | 2h 28m |
| Australian Open | 1h 54m | 2h 45m | 3h 31m | 2h 29m |
| Roland Garros | 1h 58m | 2h 47m | 3h 36m | 2h 31m |
| Wimbledon | 1h 49m | 2h 35m | 3h 24m | 2h 22m |
| U.S. Open | 1h 55m | 2h 45m | 3h 30m | 2h 28m |
Note:
Despite the U.S. Open having a fifth-set tiebreak, its average fifth-set duration is 6 minutes longer than Wimbledon's.
Wimbledon has the fewest matches that go three sets yet, on average, its matches are the quickest.
How Many Matches End in a Walkover or Retirement?
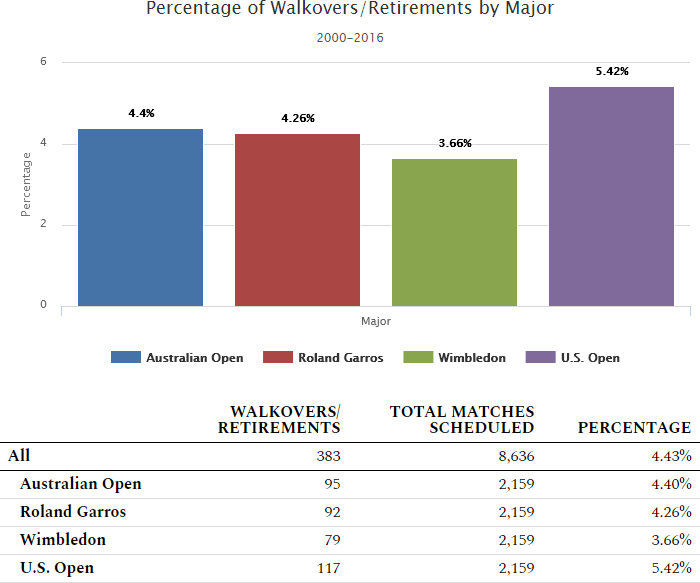
| Walkovers/ Retirements |
Total Matches Scheduled |
Percentage | |
|---|---|---|---|
| All | 383 | 8,636 | 4.43% |
| Australian Open | 95 | 2,159 | 4.40% |
| Roland Garros | 92 | 2,159 | 4.26% |
| Wimbledon | 79 | 2,159 | 3.66% |
| U.S. Open | 117 | 2,159 | 5.42% |
Significant Trends
The following charts analyze how the data has changed over time. A moving average of three-years is used in order to smooth out short-term fluctuations and highlight any longer-term trends.
How many sets does the average match last?
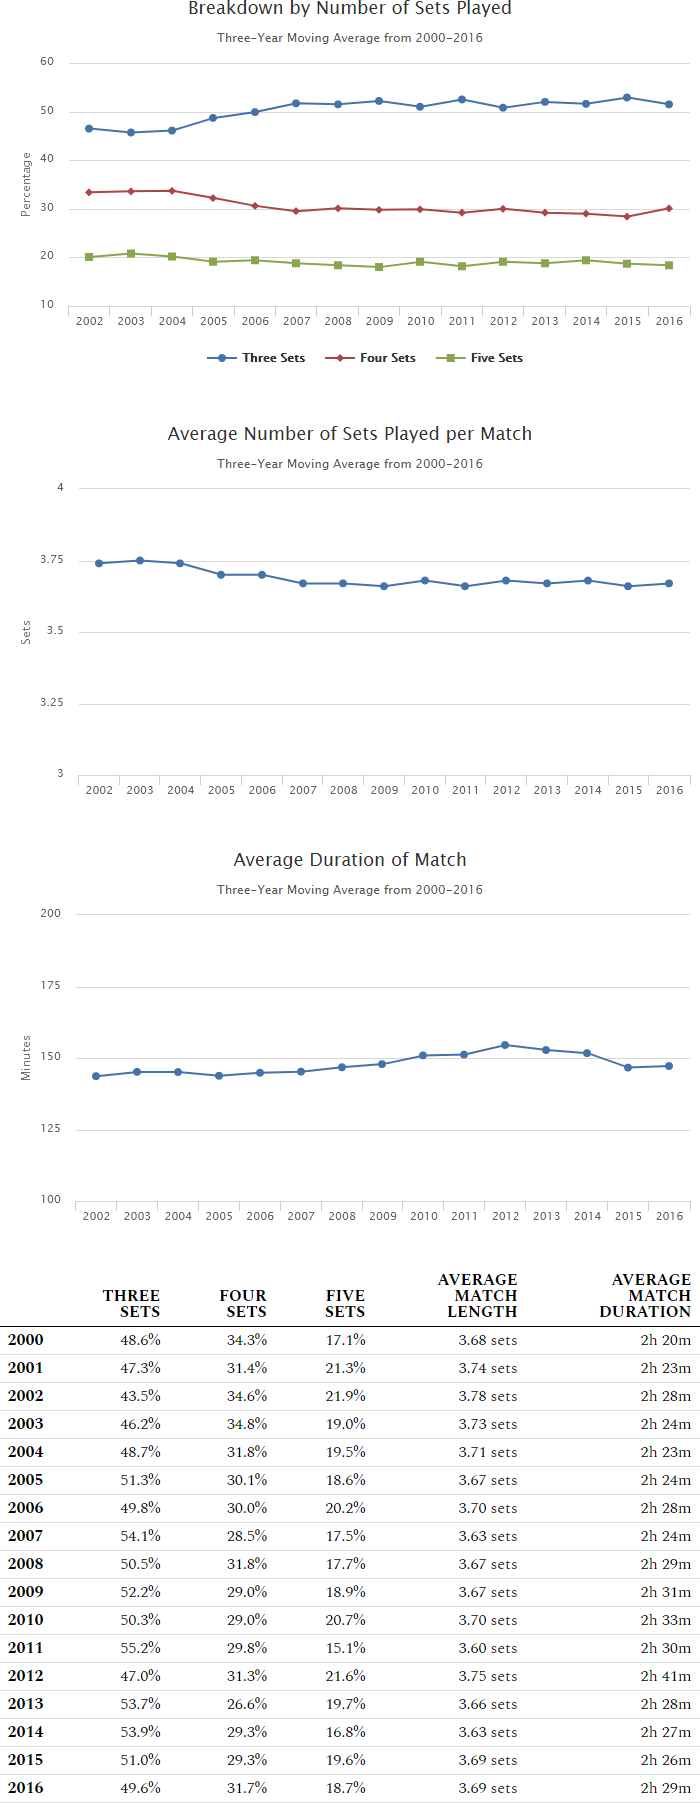
How long does the average match last?
| Three Sets | Four Sets | Five Sets | Average Match Length |
Average Match Duration |
|
|---|---|---|---|---|---|
| 2000 | 48.6% | 34.3% | 17.1% | 3.68 sets | 2h 20m |
| 2001 | 47.3% | 31.4% | 21.3% | 3.74 sets | 2h 23m |
| 2002 | 43.5% | 34.6% | 21.9% | 3.78 sets | 2h 28m |
| 2003 | 46.2% | 34.8% | 19.0% | 3.73 sets | 2h 24m |
| 2004 | 48.7% | 31.8% | 19.5% | 3.71 sets | 2h 23m |
| 2005 | 51.3% | 30.1% | 18.6% | 3.67 sets | 2h 24m |
| 2006 | 49.8% | 30.0% | 20.2% | 3.70 sets | 2h 28m |
| 2007 | 54.1% | 28.5% | 17.5% | 3.63 sets | 2h 24m |
| 2008 | 50.5% | 31.8% | 17.7% | 3.67 sets | 2h 29m |
| 2009 | 52.2% | 29.0% | 18.9% | 3.67 sets | 2h 31m |
| 2010 | 50.3% | 29.0% | 20.7% | 3.70 sets | 2h 33m |
| 2011 | 55.2% | 29.8% | 15.1% | 3.60 sets | 2h 30m |
| 2012 | 47.0% | 31.3% | 21.6% | 3.75 sets | 2h 41m |
| 2013 | 53.7% | 26.6% | 19.7% | 3.66 sets | 2h 28m |
| 2014 | 53.9% | 29.3% | 16.8% | 3.63 sets | 2h 27m |
| 2015 | 51.0% | 29.3% | 19.6% | 3.69 sets | 2h 26m |
| 2016 | 49.6% | 31.7% | 18.7% | 3.69 sets | 2h 29m |
Note:
Over time, the percentage of three-set matches has increased while the percentage of four-set matches has decreased by almost the same amount.
Even though there has been a slight decline in the average number of sets played per match, the duration of matches has increased.
Acknowledgments
Most of the raw data used for analysis was gathered from the glorious repository of ATP match results compiled by Jeff Sackmann. Additional data from the ATP Web site filled in any gaps. A Microsoft Excel file is available for download if you wish to view the raw data that I compiled.