The Effect of Reducing the Number of Seeds at Tennis Majors
Introduction
Beginning with the 2019 Australian Open, the number of seeded players at majors will be cut in half to 16, the first time it will be at that number in eighteen years. The expected result is more competitive tennis at the beginning of tournaments. But, from a historical perspective, will this really be the case? That is, after reverting to a draw of 16 seeds, will there be more upsets in the opening rounds? What follows is an analysis of 30,480 men's and women's matches at majors since 1988 that hopes to answer this question.
In addition, it may be helpful to investigate how often higher-seeded or higher-ranked players actually prevail in any of their matches at majors. Are the chances of a favored player winning a match affected by which round it's played? Are men's favorites more likely to win than women's favorites? Three charts at the end of the report shed some light on this.
The Success Rate of Seeded Players By Round
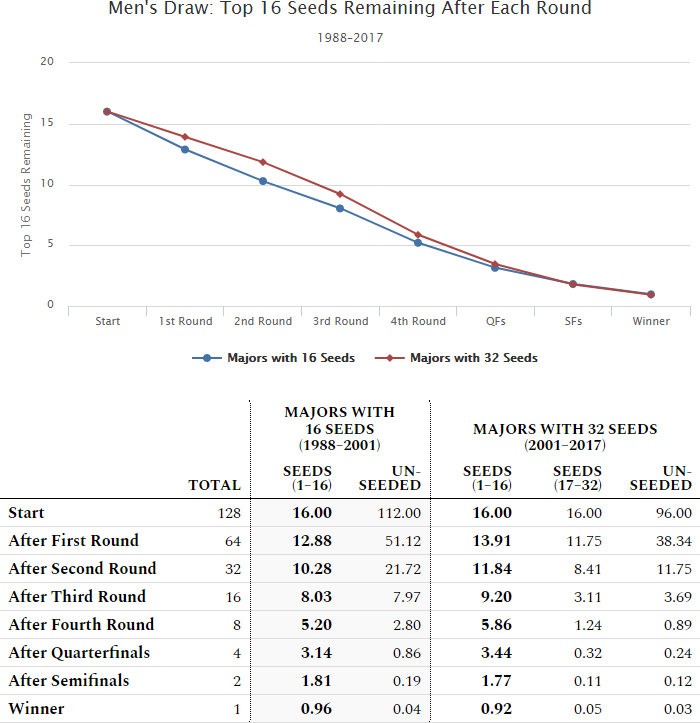
From when the Australian Open moved to a 128-player draw in 1988 until Roland Garros in 2001, there were 54 majors played with a draw of 16 seeds. This was compared to the 66 majors played through 2017 that had a draw of 32 seeds. To facilitate a more direct comparison, the results from these 66 majors were subdivided into two groups of seeds, 1–16 and 17–32.
Note that the following data represent averages based on the outcome of all matches at majors. It does not consider how an individual player advanced, whether it be from winning a match or due to an opponent's retirement or walkover — it's simply a calculation of how many players in each category remained after each round.
Men's Draw
| Majors with 16 Seeds (1988–2001) |
Majors with 32 Seeds (2001–2017) |
|||||
|---|---|---|---|---|---|---|
| Total | Seeds (1–16) |
Un- seeded |
Seeds (1–16) |
Seeds (17–32) |
Un- seeded |
|
| Start | 128 | 16.00 | 112.00 | 16.00 | 16.00 | 96.00 |
| After First Round | 64 | 12.88 | 51.12 | 13.91 | 11.75 | 38.34 |
| After Second Round | 32 | 10.28 | 21.72 | 11.84 | 8.41 | 11.75 |
| After Third Round | 16 | 8.03 | 7.97 | 9.20 | 3.11 | 3.69 |
| After Fourth Round | 8 | 5.20 | 2.80 | 5.86 | 1.24 | 0.89 |
| After Quarterfinals | 4 | 3.14 | 0.86 | 3.44 | 0.32 | 0.24 |
| After Semifinals | 2 | 1.81 | 0.19 | 1.77 | 0.11 | 0.12 |
| Winner | 1 | 0.96 | 0.04 | 0.92 | 0.05 | 0.03 |
Note:
The sample set for the majors with 16 seeds is 6,858 matches; the sample set for the majors with 32 seeds is 8,382 matches.
A draw of 16 seeds had an average of roughly one fewer seeded player advancing out of the first and third rounds.
The largest discrepancy is in the second round as shown by the widest gap between the two lines in the chart.
Starting with the fourth round, the impact of reducing the number of seeds gradually decreases.
Women's Draw
| Majors with 16 Seeds (1988–2001) |
Majors with 32 Seeds (2001–2017) |
|||||
|---|---|---|---|---|---|---|
| Total | Seeds (1–16) |
Un- seeded |
Seeds (1–16) |
Seeds (17–32) |
Un- seeded |
|
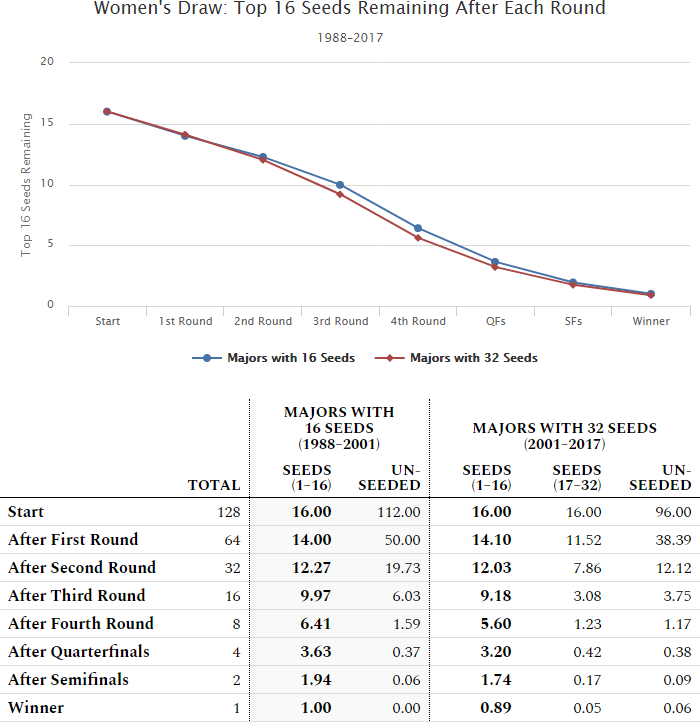
| Start | 128 | 16.00 | 112.00 | 16.00 | 16.00 | 96.00 |
| After First Round | 64 | 14.00 | 50.00 | 14.10 | 11.52 | 38.39 |
| After Second Round | 32 | 12.27 | 19.73 | 12.03 | 7.86 | 12.12 |
| After Third Round | 16 | 9.97 | 6.03 | 9.18 | 3.08 | 3.75 |
| After Fourth Round | 8 | 6.41 | 1.59 | 5.60 | 1.23 | 1.17 |
| After Quarterfinals | 4 | 3.63 | 0.37 | 3.20 | 0.42 | 0.38 |
| After Semifinals | 2 | 1.94 | 0.06 | 1.74 | 0.17 | 0.09 |
| Winner | 1 | 1.00 | 0.00 | 0.89 | 0.05 | 0.06 |
Note:
The sample set for the majors with 16 seeds is 6,858 matches; the sample set for the majors with 32 seeds is 8,382 matches.
The overall impact of the number of seeds is not as great among the women as it is for the men as evidenced by the narrower gap between the two lines in the chart.
The largest discrepancies, almost identical, are in the third and fourth rounds.
The Competitiveness of Matches at Majors
Every match played at a major has a favorite that can be objectively determined by seeding or ranking. That is, if two seeded players compete, then the one who is seeded higher is the favorite; if two unseeded players compete, then the one who is ranked higher is the favorite; if a seeded player competes against an unseeded player, then the seeded player is the favorite.
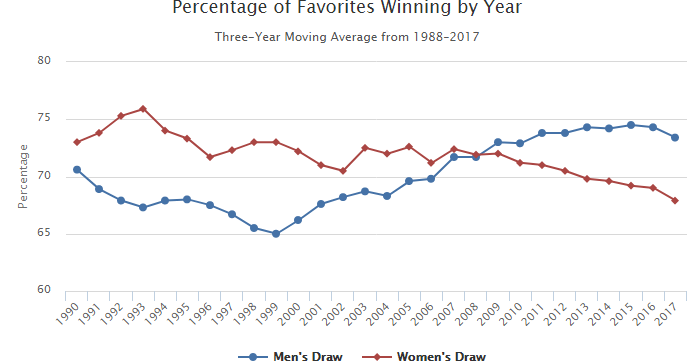
Using this as the basis, how often does the favorite actually win a match at a major? The following charts break this down by year, venue and round.
By Year
Note:
Each year has a sample set of all four majors for a total of 508 matches in each of the men's and women's draw.
The success rate of favorites for men and women have generally been headed in opposite directions over the past decade.
For the men, the inflection point was in the late 1990s when the steady decline of performance by favorites was reversed and a persistent upward trend began.
For the women, the percentage of favorites winning has been in a steady decline over the past decade.
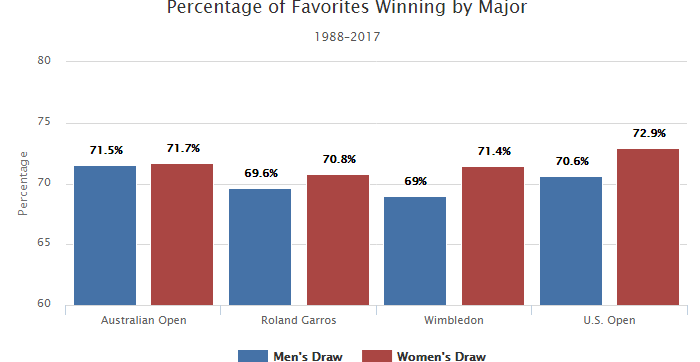
By Venue
Note:
Each major listed represents a sample set of 3,810 matches in each of the men's and women's draws.
For the women, the favorites win most often at the U.S. Open; they are upset most often at Roland Garros.
For the men, the favorites win most often at the Australian Open; they are upset most often at Wimbledon.
By Round
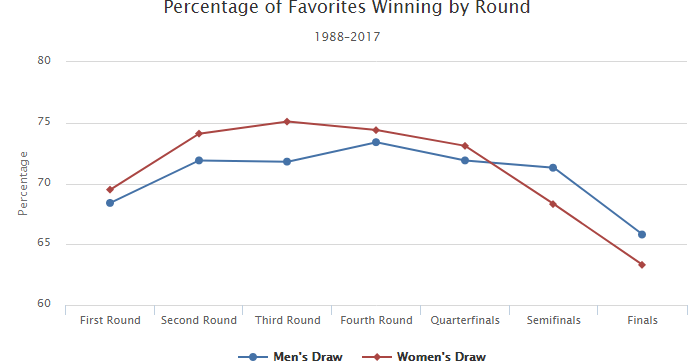
Note:
Women's favorites win more consistently than men in the early rounds, yet endure more upsets in the semifinals and finals.
The most successful round for men's favorites is the fourth; for the women, it's the third.
Acknowledgments
The raw data used for analysis was gathered from the glorious repository of ATP and WTA match results compiled by Jeff Sackmann. A Microsoft Excel file is available for download if you wish to view the raw data that I compiled.